LLM Observability: Essential Metrics and KPIs for Production
The Hidden Infrastructure Behind Reliable AI: Metrics, Tracing, and Quality Signals Every LLM Team Must Track
Aryan Gupta
December 9, 2025
LLMs have evolved from research demos to running real businesses like handling customer support, writing content, helping developers code, and powering search features people depend on daily.
But here's the catch: LLMs don't behave like normal software. Regular apps give consistent results. LLMs? They can generate different answers to the same question, misunderstand intent, or confidently produce wrong information. The complexity doesn't stop there. These systems have multiple moving parts such as prompts, retrieval systems, context windows, and model versions. One long user query can spike costs. A slow response loses users. And without proper monitoring, you won't notice problems until they've already hurt your users or budget.
White Beige Minimal Flowchart Diagram Graph (1)
Why LLM Observability Matters?
Building LLM applications breaks the rules of traditional software, which makes deep observability essential. First, LLMs are non-deterministic because unlike standard code, they generate different answers to the same input, making debugging painful and errors hard to reproduce.
Second, the structural complexity that comes from chaining prompts, vector searches, and model calls means a single failing component can ruin the entire response. Third, latency is a constant struggle since multi-step pipelines often create user-facing lag. Finally, costs can quietly skyrocket due to high token usage. Without observability, you are essentially flying blind regarding accuracy, system performance, and your budget.
LLM Observability vs Monitoring vs ML Observability
Monitoring and observability sound similar, but they answer different questions. Monitoring tells you what is happening like request counts, latency, errors, and token usage. It’s useful, but it stops at surface-level signals.
LLM observability explains why something happened. It lets you trace a request through every step from prompt creation, retrieval, model calls, and parsing, and see exactly where delays, failures, or hallucinations originate. It also exposes deeper behaviors monitoring can’t show such as prompt drift, bad context, or inconsistent outputs.
ML observability, on the other hand, was built for traditional models with fixed inputs, predictable outputs, and clear accuracy metrics. LLMs don’t fit that mold because their outputs are open-ended, subjective, and heavily shaped by context. There’s rarely a single “correct” answer to compare against.
That’s why LLM applications need their own observability layer which is built to track behavior, quality, and cost in systems where outputs change constantly and small prompt or context shifts can dramatically affect results.
Anatomy of an LLM Application
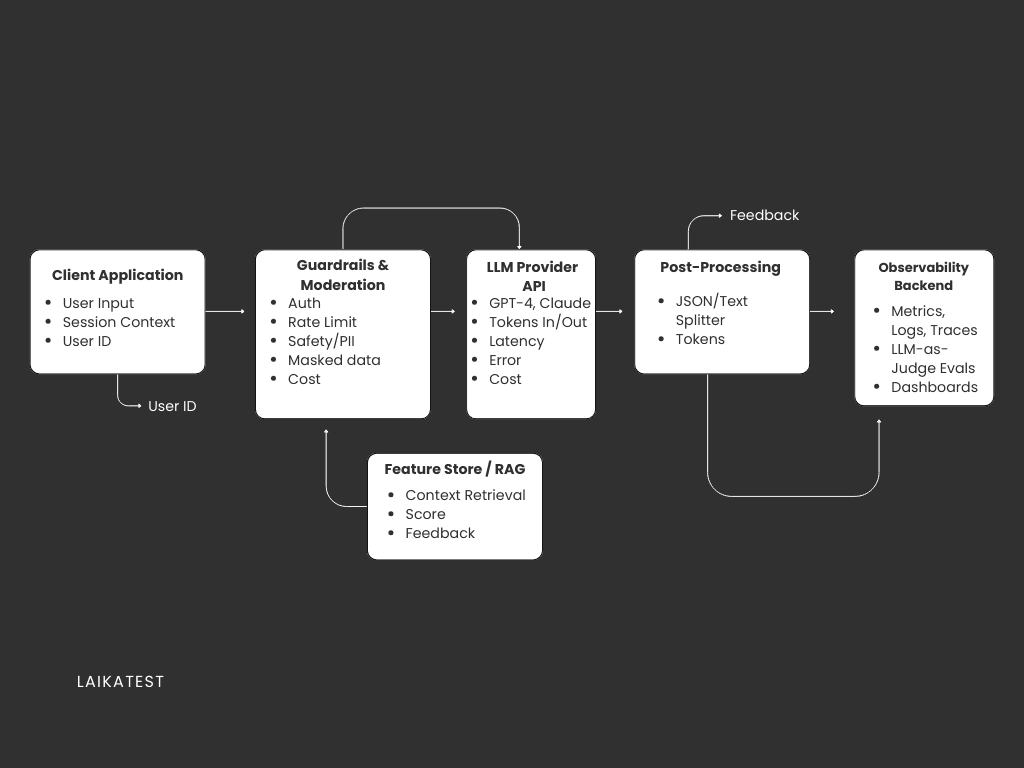
To get why observability matters, you need to see what's actually running under the hood. Even simple AI features usually need several pieces working together.
The LLM sits at the center, either through a hosted API or running on your own servers. Around it, you've got embedding models turning text into vectors, and vector databases storing and searching those embeddings for relevant info. Most apps also use RAG pipelines that grab documents and insert them into prompts to give the model extra context.
Fancier systems use chains or agents, which are multi-step workflows where the model picks what to do next like searching, summarizing, or calling external tools. And wrapping all of this is your UI or API layer where users actually interact with everything.
Here's the thing: when any piece of this pipeline acts up, your final answer tanks. That's exactly why observability isn't optional.
White Beige Minimal Flowchart Diagram Graph
Core Pillars of LLM Observability
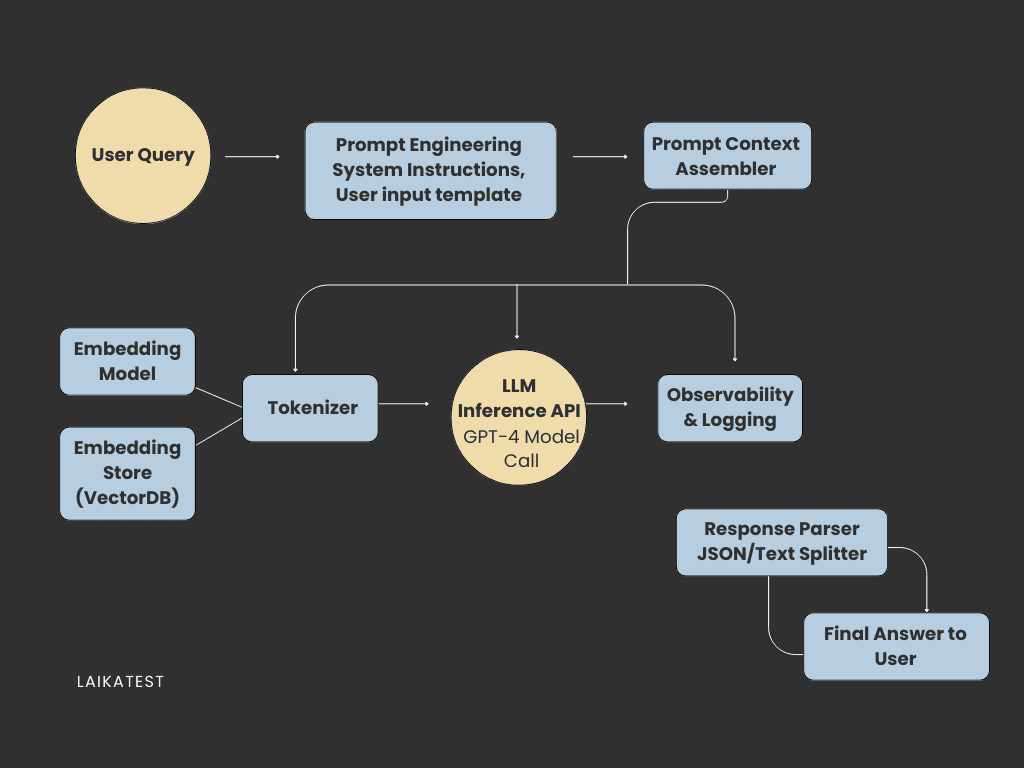
Getting visibility into LLM systems means watching five key areas that actually matter.
Request Tracing Tracing follows a single user request as it moves through your entire pipeline from prompt construction, retrieval, model calls, and final output. By seeing each step as a structured timeline, you can pinpoint exactly where delays, failures, or missing data occur instead of guessing across multiple components.
Prompt and Response Logging Logging every prompt, template version, response, and parsed output gives you the ground truth you need for debugging. When results look wrong, logs show whether the issue came from the model’s output or from how your application processed it.
Performance and Resource Monitoring These metrics tell you how efficiently your system runs. Track token usage, time-to-first-token, time-to-complete, GPU load (if self-hosted), and API latency. Spikes in generation time or token consumption act as early warnings before users notice slowdowns.
Quality Evaluation Because LLM answers aren’t strictly right or wrong, quality requires multiple signals. Use schema validation, similarity checks, and LLM-as-judge scoring to evaluate responses automatically. Supplement that with small batches of human-reviewed samples to catch issues automated tests miss.
Retrieval Analysis for RAG For RAG pipelines, retrieval quality directly affects output quality. Monitor which documents were retrieved, their relevance, retrieval latency, and whether the model actually used the context. Poor retrieval almost always leads to hallucinations, incomplete answers, or outdated information.
Essential KPI Metrics by Category
Once your LLM application is running in production, the right KPIs help you understand whether it’s performing well, slipping in quality, or quietly burning money. These metrics give you a realistic picture of how your system behaves under real user conditions.
Reliability & Performance Metrics Start with the basics: how fast and how consistently your system responds. Track latency (P50, P95, P99), timeout rates, and API failures. If the model or retrieval step suddenly slows down, these numbers will show it immediately.
Quality Metrics LLM responses are subjective, but you can still measure quality. Look at hallucination frequency, correctness scores, adherence to instructions, and consistency across similar prompts. Schema validation is especially important if your outputs must be structured.
User Experience Metrics User behavior reveals issues earlier than logs. Monitor thumbs up/down ratios, repeated queries, abandonment rate, and how often users reformulate the same question. These signals highlight where your system is confusing or frustrating people.
Cost & Efficiency Metrics Tokens equal money. Track input tokens, output tokens, cost per request, and prompts that consistently exceed your context window. If you're using agents, watch how many model calls each workflow triggers.
RAG-Specific Metrics For retrieval systems, measure relevance, recall, and retrieval latency. Poor retrieval almost always leads to poor answers.
Best Practices for LLM Observability
Good observability isn’t just about collecting data, it’s about collecting the right data and making it easy to understand. Start by versioning every prompt so you know exactly which template produced each response. Add structured logging around embeddings, retrieval, and model calls so you can trace any request end to end. Set up dashboards that track latency, token usage, and error patterns over time. Use automated evaluations to score responses, and review edge cases manually. Finally, set alerts for unusual spikes in cost or drops in quality so issues never go unnoticed.
LaikaTest’s Approach to LLM Observability
LaikaTest makes LLM behavior easy to understand by bringing observability directly into the prompt-testing workflow. Instead of guessing why a prompt works or fails, teams can compare versions, measure output quality, track token usage, and detect hallucinations or inconsistencies in one place. With built-in evaluations, scoring, and multi-model comparisons, LaikaTest turns experimentation into a repeatable, transparent process. As AI features move to production, LaikaTest gives teams the clarity they need to ship reliable, predictable, and cost-efficient LLM experiences.
Tags
#LLM Observability#AI Observability#LLM Monitoring#AI Evaluation#AI Quality Assessment